How to Calculate IRR for Smarter Investments
Learn how to calculate IRR with our practical guide. We break down the formula, Excel functions, and how to interpret the results for better decisions.

At its core, the Internal Rate of Return (IRR) is the discount rate that pushes the Net Present Value (NPV) of all your future cash flows down to zero. Think of it as the breakeven point for your investment's annualized return. While you could solve for it manually with some painful trial-and-error, thankfully, tools like Excel's =IRR() function handle all the complex math for us.
What IRR Is and Why It Matters for Your Investments

The Internal Rate of Return is one of the most important metrics in finance because it shows you the true, time-adjusted profitability of an investment. It answers a simple but powerful question: "What's the actual annual growth rate I'm getting from this?" This gives you a universal benchmark to compare completely different opportunities on an apples-to-apples basis.
Let's say you're looking at two potential deals. One is a commercial real estate property that will generate steady rental income over the next decade. The other is a stake in a tech startup that promises a single, massive payout in five years. How do you compare them? IRR is the tool for the job. It cuts through the different timelines and cash flow patterns to give you a single percentage for each, making your decision a whole lot easier.
The Power of a Single Percentage
The real magic of IRR is how it accounts for the time value of money—the fundamental idea that a dollar in your pocket today is worth more than a dollar you'll receive next year. The calculation finds the exact annualized return rate where all future cash flows, when discounted back to the present, perfectly balance out your initial investment.
This is what makes it so incredibly useful for a few key tasks:
- Comparing Projects: It lets you standardize the returns from various investments, whether they last one year or twenty.
- Setting Benchmarks: You can establish a "hurdle rate" – your absolute minimum acceptable return. If a project's IRR doesn't clear that bar, you pass. Simple as that.
- Informing Strategy: For fund managers, IRR isn't just about picking winners. It's a critical part of the story you tell through your financial reporting. A strong handle on IRR goes hand-in-hand with the skills we cover in our guide on https://www.fundpilot.app/blog/fund-accounting-basics-for-modern-managers.
To help clarify these concepts, here’s a quick breakdown of the core components of IRR.
IRR at a Glance Key Concepts
| Concept | What It Means for Your Investment |
|---|---|
| Initial Outlay | This is the cash you invest upfront (a negative number). It's the starting point for your entire calculation. |
| Future Cash Flows | These are all the expected returns, profits, or dividends your investment will generate over time (positive numbers). |
| Net Present Value (NPV) | The current value of all future cash flows, discounted back to today. IRR is the rate that makes NPV equal zero. |
| Hurdle Rate | Your personal or organizational minimum acceptable rate of return. You compare the calculated IRR to this figure. |
This table shows how IRR is more than just a number; it's a framework for thinking about an investment from start to finish.
More Than Just a Number
Ultimately, IRR forces you to look beyond a simple return percentage and map out the entire financial life of a project. You have to think critically about your initial investment (the outflow) and every single future return (the inflows).
The IRR is the percentage rate earned on each dollar invested for each period it is invested. It’s a dynamic measure that tracks the return on the capital still at work in the project.
This planning process itself is where a lot of the value lies. To get an accurate IRR, you first need solid projections. If you don't have a good handle on how to forecast sales and leverage data for growth, your IRR calculation will be based on guesswork. By taking the time to think through the entire lifecycle, you gain a much deeper understanding of the risks and rewards before you ever commit a dime.
The Math Behind the IRR Formula

To really get a feel for what IRR is telling you, it helps to peek under the hood. While we all rely on software to do the heavy lifting, understanding the logic behind the calculation makes it a far more powerful tool in your hands.
At its core, the IRR is just the specific interest rate that makes the value of all your future profits equal to what you paid for the investment today. In other words, it’s the break-even point.
This entire concept is built on the idea of Net Present Value (NPV). The NPV formula is simply a way to figure out what future cash flows are worth in today's money. The IRR is the special discount rate that makes this NPV calculation equal exactly zero.
The Core Equation Explained
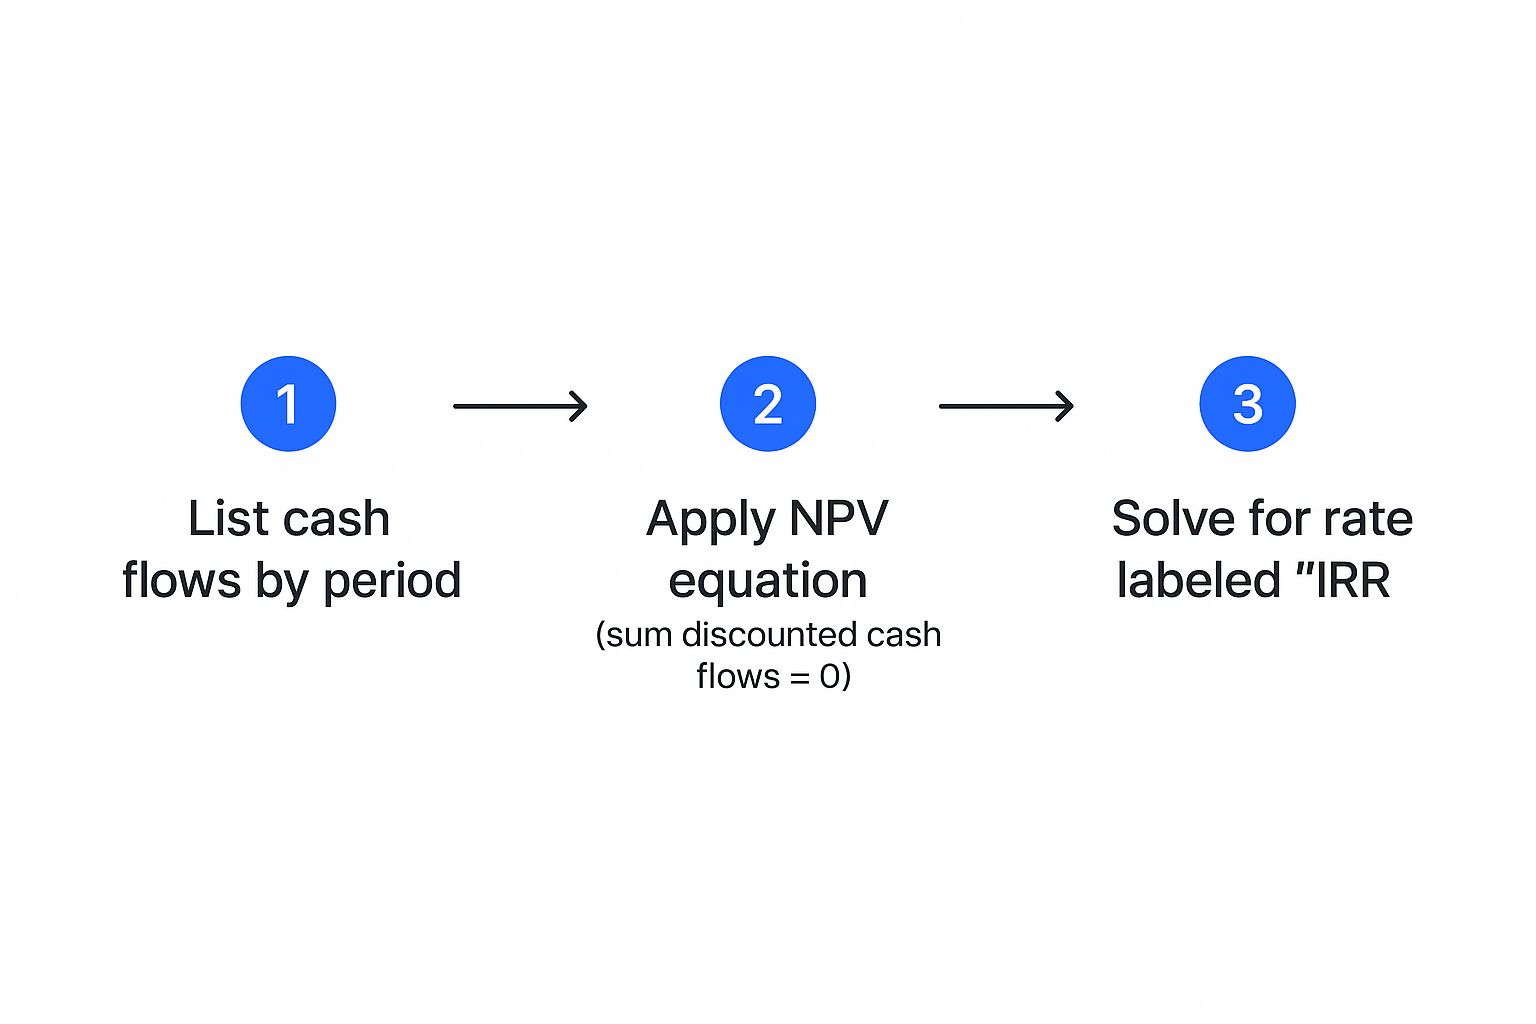
The formula itself can look a bit intimidating at first glance, but the concept is actually pretty simple. It’s just a running total of every cash flow, discounted back to its present value based on when you receive it.
The goal is to find the value of 'r' (the IRR) that makes this equation true:
NPV = 0 = CF₀ + [ CF₁ / (1+r)¹ ] + [ CF₂ / (1+r)² ] + ... + [ CFₙ / (1+r)ⁿ ]
Let's quickly break down what each piece means:
- CF₀ is your initial investment. This is always a negative number because it's cash going out the door.
- CF₁, CF₂, and so on are the positive cash inflows you expect to get back in year one, year two, etc.
- r is the Internal Rate of Return—this is the mystery number we're trying to find.
Because of the exponents in the formula, you can't just shuffle it around to solve for 'r' directly. It requires a bit of trial and error, which is precisely why financial calculators and spreadsheets are our best friends here. They can run through hundreds of guesses in a split second to find the rate that makes the whole thing balance out to zero.
A Manual Calculation Example
Let's walk through a real-world scenario to see how this works.
Imagine a small logistics company is thinking about buying a new delivery truck for $50,000. They've crunched the numbers and project it will generate these additional cash flows over the next three years:
- Year 1: $20,000
- Year 2: $25,000
- Year 3: $15,000
Plugging this into our formula, we get:
0 = -50,000 + [ 20,000 / (1+r)¹ ] + [ 25,000 / (1+r)² ] + [ 15,000 / (1+r)³ ]
Now, to solve this the old-fashioned way, we have to start guessing. Let's try a 10% discount rate first and see what happens to the NPV:
NPV = -50,000 + ($18,182 + $20,661 + $11,270) = $113
The NPV is positive, which tells us the actual return is higher than 10%. So, we need to try a higher rate to get the NPV down toward zero. Let’s test 11%:
NPV = -50,000 + ($18,018 + $20,288 + $10,968) = -$726
Now our NPV is negative. We've overshot it. This tells us the true IRR is somewhere between 10% and 11%. This back-and-forth process is exactly what Excel's IRR function does instantly. For this project, the actual IRR is roughly 10.07%.
This is a crucial takeaway: IRR isn't just a final return figure. It represents the percentage rate you earn on every dollar that remains invested in the project, year after year. It's a dynamic measure of how hard your capital is working.
Another Look at Cash Flows
The timing and size of your cash flows have a huge impact on the final IRR.
Consider another project with an initial investment of -$123,400. This one generates lumpy inflows of $36,200, $54,800, and $48,100 over three years. This kind of uneven cash flow is much more common in the real world.
When you run these numbers through the same process, you'll find the discount rate that sets the NPV to zero is approximately 5.96%. You can find more detailed examples of IRR calculations to see this in action with different numbers. It’s a great way to reinforce why understanding the math is so valuable, even when you let the software handle the final answer.
How to Calculate IRR Using Excel
While it’s good to know the math behind IRR, let's be realistic—the real world of finance lives inside spreadsheets. For just about any professional, Excel is the tool of choice for calculating IRR. It handles all the heavy lifting and iterative guesswork, giving you a precise answer in a fraction of a second. This is where the theory hits the pavement.
For fund managers and investors, being fluent in Excel's financial functions isn't just a nice-to-have; it's essential. It lets you model scenarios on the fly, stack up different opportunities, and back your decisions with hard numbers. We'll walk through the two key functions you need to know: IRR and XIRR.
Using the Standard IRR Function for Periodic Cash Flows
The simplest way to get the job done in Excel is with the =IRR() function. It's built for investments with cash flows that hit at regular, predictable intervals—think annual dividends, quarterly lease payments, or monthly loan repayments. A rental property that brings in a steady check each year is a perfect use case.
All you need is a single column listing your cash flows in chronological order. Just remember, the very first number has to be your initial investment, and it must be negative.
Let's look at a straightforward project:
- Initial Investment (Year 0): -$100,000
- Year 1 Return: $30,000
- Year 2 Return: $40,000
- Year 3 Return: $50,000
If you pop those numbers into cells A1 through A4, your formula is as simple as =IRR(A1:A4). Excel does the work and gives you 14.3%.
Pro Tip: Ever get that frustrating
#NUM!error? It usually means Excel is struggling to find a solution. An easy fix is to give it a "guess." Try something like=IRR(A1:A4, 0.1). That0.1gives Excel a starting point (10%) for its calculations and often helps it zero in on the right answer, especially with more complex cash flow streams.
Handling Irregular Cash Flows with XIRR
Of course, reality is rarely that neat. Investments don't always follow a clean, predictable schedule. A venture capital deal might involve follow-on funding rounds at odd times, and a consulting project could have payments coming in sporadically. When your cash flows are all over the calendar, the standard IRR function just won't cut it.
That’s when you need to bring out the big gun: the =XIRR() function.
The XIRR function is specifically designed for these messy, real-world scenarios. It needs two pieces of information instead of one:
- A list of all the cash flow amounts.
- A corresponding list of the exact dates for each of those cash flows.
This process shows that no matter how you calculate it, the core logic is always about finding that one discount rate that makes the investment's NPV zero.
Let’s map out a more complex investment scenario:
- Jan 15, 2023: -$50,000 (Initial Investment)
- Sep 5, 2023: $10,000 (First Return)
- Feb 20, 2024: $25,000 (Second Return)
- Dec 1, 2024: $30,000 (Final Return & Exit)
If you put the dates in cells A1:A4 and the cash flows in B1:B4, your formula would be =XIRR(B1:B4, A1:A4). Excel crunches the numbers and gives you an annualized return of 23.9%.
This level of precision is absolutely critical for fund managers juggling capital calls and distributions, which rarely happen on a neat schedule. To get a deeper dive on this, take a look at our guide on what is fund finance.
Best Practices for Excel IRR Calculations
Getting the formula right is only half the battle. How you structure your spreadsheet can make the difference between a clear, reliable model and a confusing mess. Always build your models to be clean, well-labeled, and easy for someone else to pick up.
Here are a few tips from the trenches:
- Label Everything Clearly: Don't just dump numbers in. Use headers like "Date," "Cash Flow," and "Description." You'll thank yourself when you revisit the model six months later.
- Use Cell References, Not Hard-Coded Numbers: This is a golden rule. Never type numbers directly into a formula. By referencing the cells that hold your data, you can easily change inputs and run different what-if scenarios without having to rewrite anything.
- Keep Your Assumptions Separate: I always create an "Assumptions" or "Inputs" section at the top of my sheet for things like the initial investment amount or projected growth rates. It makes the model dynamic and far more user-friendly.
IRR is a powerful tool, but it's rarely used in a vacuum. To get a truly well-rounded view of an investment's health, it’s worth Mastering other Excel financial formulas like NPV (Net Present Value) and PMT (Payment). Combining these functions allows you to build a much more robust financial model that tells the whole story.
So, you've crunched the numbers and have an Internal Rate of Return staring you in the face. Let's say it's 17%. Now what? Is that good? Bad? The real skill isn't in the calculation—it's in the interpretation. This is where a number on a spreadsheet transforms into a smart business decision.
The most straightforward way to start is by pitting your IRR against your hurdle rate. Think of the hurdle rate as your personal minimum acceptable return for an investment. It’s the bar the project has to clear to even be in the running.
If your hurdle rate is 12% and the project’s IRR is 17%, you're in a good spot. It’s a potential green light. But if that IRR comes in at 9%, it’s a non-starter because it doesn't meet your minimum threshold. This simple check is your first, and most critical, filter.
Context Is Everything What Defines a Good IRR
There’s no magic number for a "good" IRR. What looks fantastic for one type of deal could be a complete dud for another. It all comes down to the context of the investment, with risk being the biggest factor.
Here’s how I think about it in practice:
-
Low-Risk Investments: For something pretty stable, like a government bond or a fully-leased commercial building in a great neighborhood, you're not expecting fireworks. A high single-digit IRR, say 6-9%, is often perfectly acceptable because the chance of losing your money is incredibly low.
-
Moderate-Risk Investments: This is where things get more interesting. Think of a value-add real estate project or buying into a profitable small business. There's more uncertainty, so you need to be compensated for it. I'd be looking for an IRR in the 12-20% range here.
-
High-Risk Investments: Welcome to the world of venture capital and early-stage startups. The risk here is enormous, and many of these bets go to zero. To justify that kind of exposure, investors are typically hunting for IRRs of 25% or even higher.
An investment's IRR must always be evaluated against its risk profile. A high IRR is only "good" if it adequately compensates you for the potential downsides and the opportunity cost of putting your capital elsewhere.
Looking Beyond a Single Metric
Relying solely on IRR is like trying to drive a car by only looking out one window—you're going to miss something important. To get the full picture, you need to pair it with other key metrics. Each one tells a slightly different part of the story, giving you a much more complete and reliable view.
In the venture capital world, for example, IRR is often the headline number funds use to show off their performance. But any seasoned investor will immediately look at it alongside the Total Value to Paid-In (TVPI) multiple. TVPI tells you how much value has been created relative to the capital invested, but it doesn't care about when that value was created. IRR, being an annualized figure, is better for comparing funds on different timelines.
If you really want to stress-test your assumptions and see how your IRR might hold up under different economic conditions, you can dig into more advanced modeling techniques like Monte Carlo simulation.
With so many acronyms floating around, it can be tough to keep them straight. Here’s a quick breakdown of the big three and when to pull them out of your toolkit.
IRR vs NPV vs TVPI Which Metric to Use When
| Metric | What It Measures | Best For |
|---|---|---|
| IRR | The annualized rate of return | Comparing projects with different timelines and cash flow patterns. |
| NPV | The total value an investment adds in today's dollars | Deciding between mutually exclusive projects. The one with the higher NPV creates more absolute value. |
| TVPI | The total value returned as a multiple of the initial investment | Getting a simple, time-agnostic measure of how much your money has multiplied. |
Using these metrics together is the difference between simply calculating a number and truly understanding an investment from all angles. It’s this multi-faceted analysis that separates amateur and professional investors and leads to consistently smarter decisions about where to put your money.
Common IRR Mistakes and How to Avoid Them
The Internal Rate of Return is a fantastic tool for sizing up an investment’s potential, but if you rely on it blindly, you're setting yourself up for some bad decisions. IRR has some serious blind spots and quirks that can easily mislead you if you’re not careful. Honestly, knowing the pitfalls is just as crucial as knowing how to run the calculation.
One of the strangest issues you can run into is the multiple IRR problem. This weirdness pops up with unconventional projects—specifically, those where the cash flows flip from positive to negative more than once. Imagine a project that requires a hefty cleanup cost at the very end, turning that final cash flow negative.
Mathematically, this kind of cash flow stream can spit out more than one valid IRR. You're left with an ambiguous result that’s pretty much useless. It creates a ton of confusion because you have no way of knowing which rate—if any—is the true reflection of the project's profitability.
The Reinvestment Rate Assumption Flaw
Now for a more subtle but equally critical limitation: IRR's built-in reinvestment assumption. The formula inherently assumes that every dollar of positive cash flow you get during the project's life is immediately reinvested to earn a return equal to the final IRR.
Let that sink in for a minute. If your project boasts a stellar 25% IRR, the math pretends you can take every bit of profit and instantly find another investment that also pays out 25%. In the real world, finding opportunities like that consistently is next to impossible.
This assumption can make projects with high IRRs look far better than they actually are. It seriously inflates the long-term value because the compounding effect is based on a reinvestment rate you'll likely never achieve. It's a classic trap that leads investors to overestimate their future returns.
The real issue with IRR is that it measures efficiency, not absolute value. A sky-high IRR on a small project might create far less wealth than a decent IRR on a much larger one.
How to Counteract IRR's Limitations
Fortunately, you don't have to throw IRR out the window. The trick is to pair it with other metrics and, when the situation calls for it, use a smarter variation. This creates a system of checks and balances, giving you a much more realistic view of an investment's true potential.
Here are a few practical ways to keep yourself from getting misled:
-
Always Use NPV Alongside IRR: Think of Net Present Value (NPV) as IRR's best friend. While IRR gives you a percentage, NPV tells you the total value a project is expected to create, in today's dollars. If you're comparing two mutually exclusive projects, the one with the higher NPV is almost always the better financial choice, even if its IRR is lower.
-
Calculate the Modified Internal Rate of Return (MIRR): MIRR was literally designed to fix IRR's biggest problems. It lets you plug in a realistic reinvestment rate for your cash flows, resulting in a much more conservative and believable return figure. As a bonus, it also solves the multiple IRR problem.
-
Consider the Scale of the Investment: IRR doesn't care about the size of the deal. A 100% IRR on a $1,000 investment only makes you $1,000, while a 20% IRR on a $100,000 investment nets you $20,000. Never let a flashy IRR distract you from the actual dollar amount you stand to make.
By building these safeguards into your analysis, you can harness the power of IRR while protecting yourself from its weaknesses. For fund managers, this kind of analytical rigor is absolutely essential. You can see how these metrics play out in a high-stakes environment by exploring our guide to master private equity deal sourcing. At the end of the day, the goal is to build a complete financial story, not just rely on a single, and sometimes flawed, headline number.
Answering Your Top IRR Questions
Even after you get the hang of the calculations, certain questions about IRR always seem to come up. Let's tackle the most common ones I hear, so you can start applying IRR with more confidence.
What's the Real Difference Between IRR and ROI?
It's easy to mix up IRR and Return on Investment (ROI), but they measure fundamentally different things. ROI gives you a simple, high-level look at your total gain or loss as a percentage of your initial investment. The problem? It's completely blind to time.
A 50% ROI sounds great, but it doesn't tell you if that return took one year or ten years to materialize. This is where IRR shines. It gives you an annualized rate of return, making it a much better tool for comparing different investment opportunities that have varying timelines and cash flow schedules.
Can IRR Be Negative? What Does That Even Mean?
Yes, it absolutely can. A negative IRR is a big red flag, signaling that the project is expected to be a money-loser. Simply put, it means the total cash you get back won't even cover your initial outlay.
Think of it as the project's annualized loss rate. An IRR of -5% means you're effectively losing 5% each year on the capital tied up in that investment. Unless there's some massive strategic benefit that's not captured in the numbers, a negative IRR is a clear sign to walk away.
Help! Why Is Excel Giving Me a #NUM! Error?
Ah, the dreaded #NUM! error. When Excel's IRR function throws a fit, it's almost always for one of two reasons, and luckily, they're usually easy to fix.
-
You need both positive and negative cash flows. Your data range has to include at least one negative number (your investment) and at least one positive number (your returns). Without an outflow and an inflow, a rate of return is mathematically impossible to find.
-
Excel's solver is stuck. Sometimes, with more unusual cash flow patterns, Excel's internal calculation just can't land on an answer. You can give it a little nudge by providing a "guess" in the formula.
For instance, instead of
=IRR(A1:A5), try=IRR(A1:A5, 0.1). That0.1tells Excel to start its search around 10%, which often helps it find the solution.
Getting comfortable with these practical details is what separates knowing the definition of IRR from actually using it effectively to make smarter investment decisions.
Tired of wrestling with spreadsheets to manage your fund's performance? Fundpilot provides institutional-grade tools to automate your reporting, administration, and compliance, letting you move beyond manual work. See how you can streamline operations and elevate your LP communications by exploring Fundpilot today.