A Founder's Guide to Shares Fully Diluted
Understand shares fully diluted and why this metric is critical for your company's valuation. Learn how to calculate it and avoid common pitfalls.

Picture this: you own 20% of a fast-growing startup, and things are looking great. Then, after a new round of funding, you glance at the cap table and your stake isn't 20% anymore. It's smaller. What happened? The answer isn't in the shares that exist today, but in the ones that could exist tomorrow. This is the world of fully diluted shares.
The Hidden Number That Defines Your Ownership

Think of your company's equity like a pizza. When you first start, you know exactly how many slices there are. But what if there are a bunch of "slice IOUs" sitting off to the side—promises made to early employees, investors, or advisors?
Those IOUs are things like stock options, warrants, and convertible notes. If and when they're cashed in, the company has to cut new slices. Suddenly, the whole pizza is divided into more pieces, and everyone's original slice gets a little bit thinner. That's dilution in a nutshell.
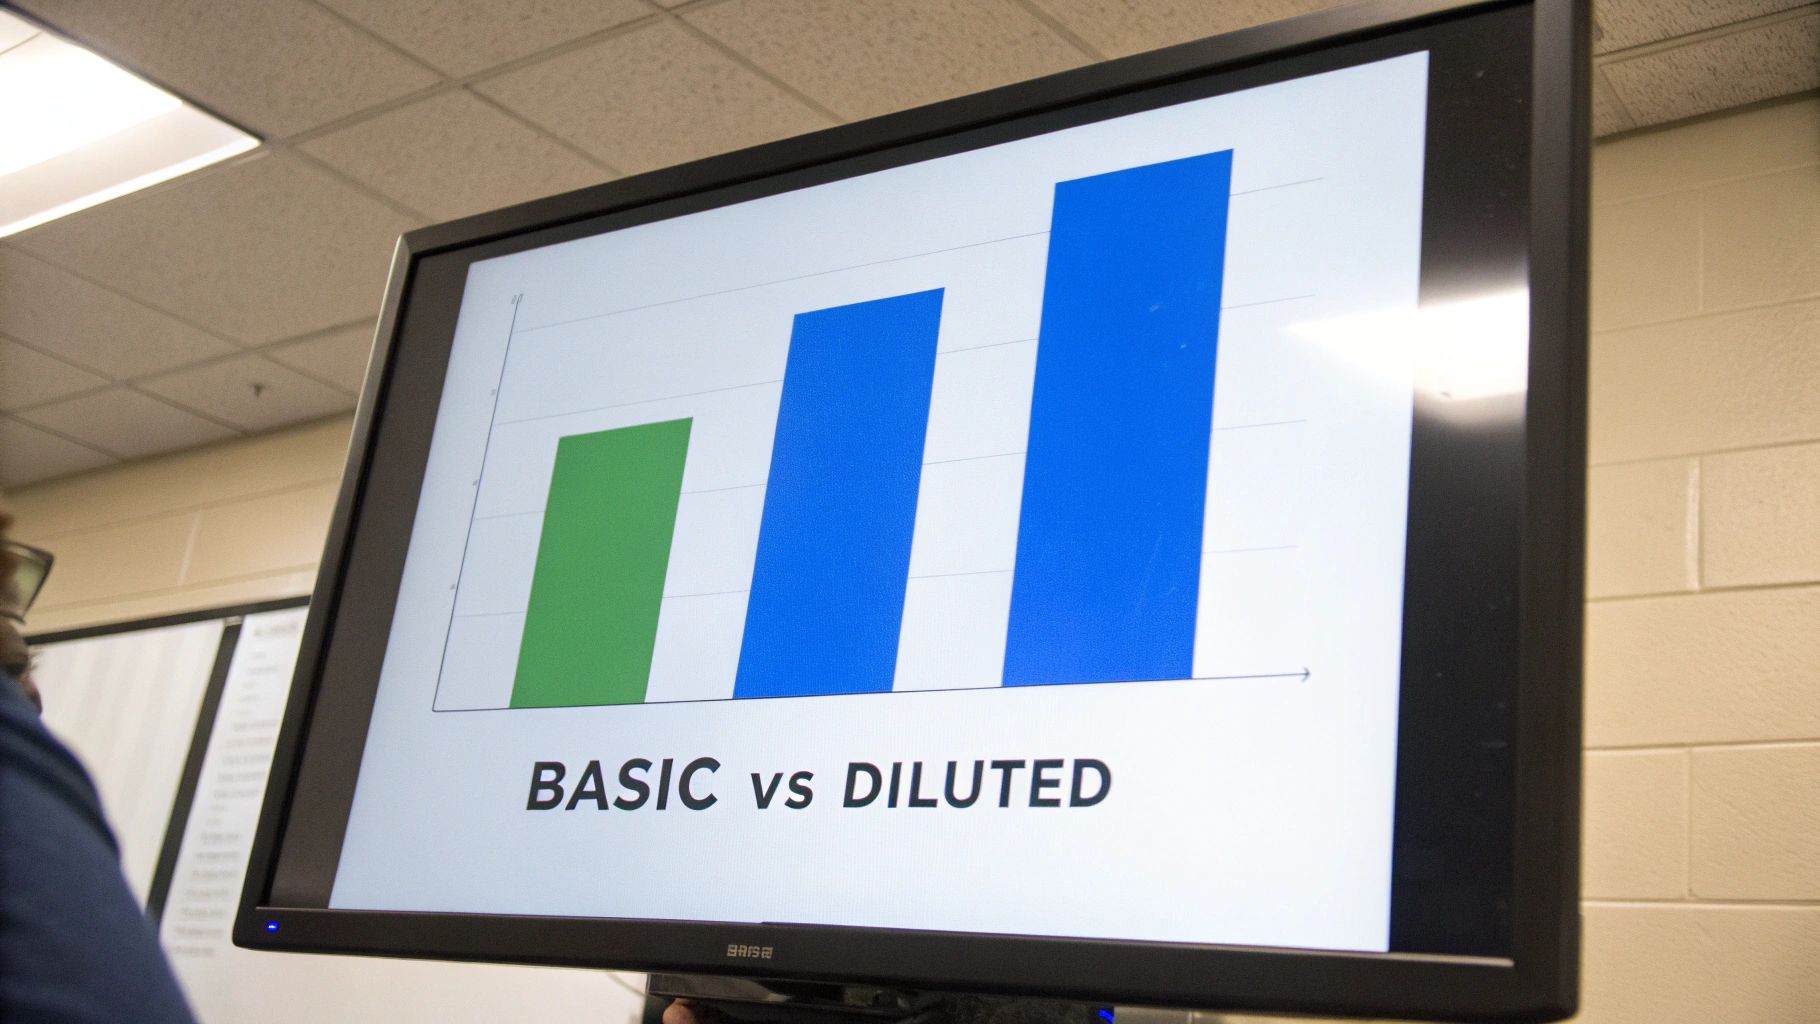
This is why just looking at the current number of shares—the basic shares outstanding—tells you only part of the story. The fully diluted share count gives you the complete picture. It's the total number of shares that would exist if every single one of those IOUs were converted into actual stock. It’s the worst-case scenario for your ownership percentage, which makes it the most realistic and crucial number to watch.
From Basic Shares to a Complete Picture
To get a quick sense of the difference, this table breaks down what each calculation includes.
Basic vs Fully Diluted Shares at a Glance
| Metric | Basic Shares Outstanding | Fully Diluted Shares |
|---|---|---|
| What it includes | Only common stock currently issued and held by investors, founders, and employees. | All issued common stock PLUS all potential shares from options, warrants, and convertible securities. |
| What it tells you | A snapshot of ownership right now. | A forward-looking, "what-if" view of ownership. |
| Best for | Simple, present-day reporting. | Accurate valuation, investment analysis, and assessing true ownership dilution. |
As you can see, relying only on basic shares gives you a dangerously incomplete picture.
The true number has to account for all those potential shares that have been promised. So, if a company has 4 million common shares in circulation, but also 500,000 unexercised stock options and another 500,000 shares tied up in other convertible instruments, its fully diluted share count is actually 5 million. For a deeper dive into how these components stack up, you can find great insights from SmartAsset.
This comprehensive figure isn't just an accounting detail; it's fundamental. For founders, it's the real measure of their control. For investors, it dictates their actual return on investment. And for employees, it reveals the true potential value of their stock options.
By looking at the fully diluted share count, you are stress-testing your ownership against a future where every promise of equity has been fulfilled. It’s the only way to see the genuine value of your stake.
Why Dilution Is a Critical Metric for Investors
Ignoring dilution is like trying to navigate the open sea with an incomplete map—you're setting yourself up for costly and completely avoidable surprises. For any serious investor, from a VC scrutinizing a term sheet to an LP reviewing fund performance, the shares fully diluted count isn't just another number. It's the foundation of any sound investment analysis.
This single figure directly shapes three critical areas: your ownership percentage, your voting power, and core financial metrics like Earnings Per Share (EPS). A basic share count might tell you that you own 10% of a company. But the fully diluted number could reveal your actual stake is closer to 7%. That's a massive difference with very real consequences.
The True Cost of Overlooking Potential Shares
When you rely on a non-diluted share count, you're almost guaranteed to overvalue your investment. Let's say you value a company based on 10 million shares outstanding, but the fully diluted count is actually 12 million. You've just overpaid by 20%. It’s that simple. This is precisely why professional investors build their entire financial model on the fully diluted number—it gives them the most conservative and realistic picture of a company's per-share value.
For fund managers, getting this right is non-negotiable. It's a core part of their duty, and our guide on the fair valuation of shares digs deeper into how an accurate share count is tied directly to proper valuation practices.
The impact of dilution echoes through every stage of a company's life:
- VC Term Sheets: Nearly all funding round negotiations start with a pre-money valuation divided by the fully diluted share count. Get that count wrong, and the deal terms can shift dramatically against you.
- Employee Option Pools: A large, unallocated option pool can accidentally give early investors a windfall during SAFE conversions, diluting founders more than they intended. A 20% unissued option pool can significantly lower the price per share for those converting notes, handing them a better deal at the founders' expense.
- Public Market Analysis: For public companies, diluted EPS is the standard reported under GAAP for a reason. It provides a much more honest picture of profitability by factoring in all potential shares waiting in the wings from stock options and other convertible instruments.
Why Every Potential Share Matters
At the end of the day, every potential share represents a future claim on the company’s earnings and assets. When you overlook those claims, you fundamentally misunderstand your real position. Your voting power gets watered down, and your piece of the pie shrinks during an exit event like an acquisition or IPO.
Think of it this way: The basic share count shows you the size of your slice of the pie today. The fully diluted share count shows you how small that same slice will be after everyone who was ever promised a piece comes to the table. For investors, the second number is the only one that truly matters for assessing risk and potential return.
Calculating Your Fully Diluted Share Count
Theory is great, but the best way to really understand dilution is to get your hands dirty and see the numbers in action. To truly grasp what shares fully diluted means for a company, we need to build a capitalization table (or cap table) from the ground up.
Let's walk through it with a fictional startup, Innovate Inc., and see how each new piece of the puzzle adds another layer to the calculation.
Think of it as a simple addition problem that gets progressively more detailed. You start with the most basic number—the shares already out there—and then layer in every potential source of new shares.
Step 1: Start with Basic Shares Outstanding
The foundation of any ownership calculation is the number of common shares that have already been issued and are held by founders, early employees, and investors. This is your starting line. It’s the simplest picture of the company's ownership before any potential dilution kicks in.
For our example, let's say Innovate Inc. is founder-owned.
- Founder A: 4,000,000 shares
- Founder B: 4,000,000 shares
- Total Basic Shares Outstanding: 8,000,000
This initial figure is straightforward, but it's just the first piece. If you're looking for a deeper dive into setting up this initial structure, a good guide to cap table management can offer some crucial context.
Step 2: Add Shares from Convertible Instruments
Next up, you have to account for any securities that are designed to turn into common stock down the road. This typically includes things like convertible notes or Simple Agreements for Future Equity (SAFEs), which are common in early-stage funding rounds. They are essentially a promise of future equity.
Let's say Innovate Inc. raised a pre-seed round using convertible notes. When their next funding round closes, those notes will convert into 1,000,000 shares of common stock.
By adding these convertibles, you're recognizing the equity claims of your earliest backers. If you ignored them, you'd be painting a false picture of the company's ownership, since their conversion is practically a sure thing in a future financing event.
Adding this to our running total gives us a much clearer view: 8,000,000 (Basic Shares) + 1,000,000 (Convertible Shares) = 9,000,000 shares.
Step 3: Factor in All Potential Options and Warrants
The final, and often most significant, layer includes all issued stock options, warrants, and any other rights to purchase stock. This bucket should include both vested and unvested options from the employee stock option pool (ESOP). The logic here is simple: every option granted represents a potential future shareholder.
Innovate Inc. has set up an option pool to attract top talent and has also issued warrants to key advisors.
- Employee Stock Options Granted: 1,500,000 shares
- Warrants Issued to Advisors: 250,000 shares
- Reserved but Ungranted Options in ESOP: 250,000 shares
It's absolutely critical to include the entire option pool—both the granted options and the ungranted reserves. Why? Because investors will almost always insist on it during valuation discussions to ensure the pre-money valuation already accounts for all planned equity compensation.
The infographic below shows how these pieces stack up to give you the final, complete picture.
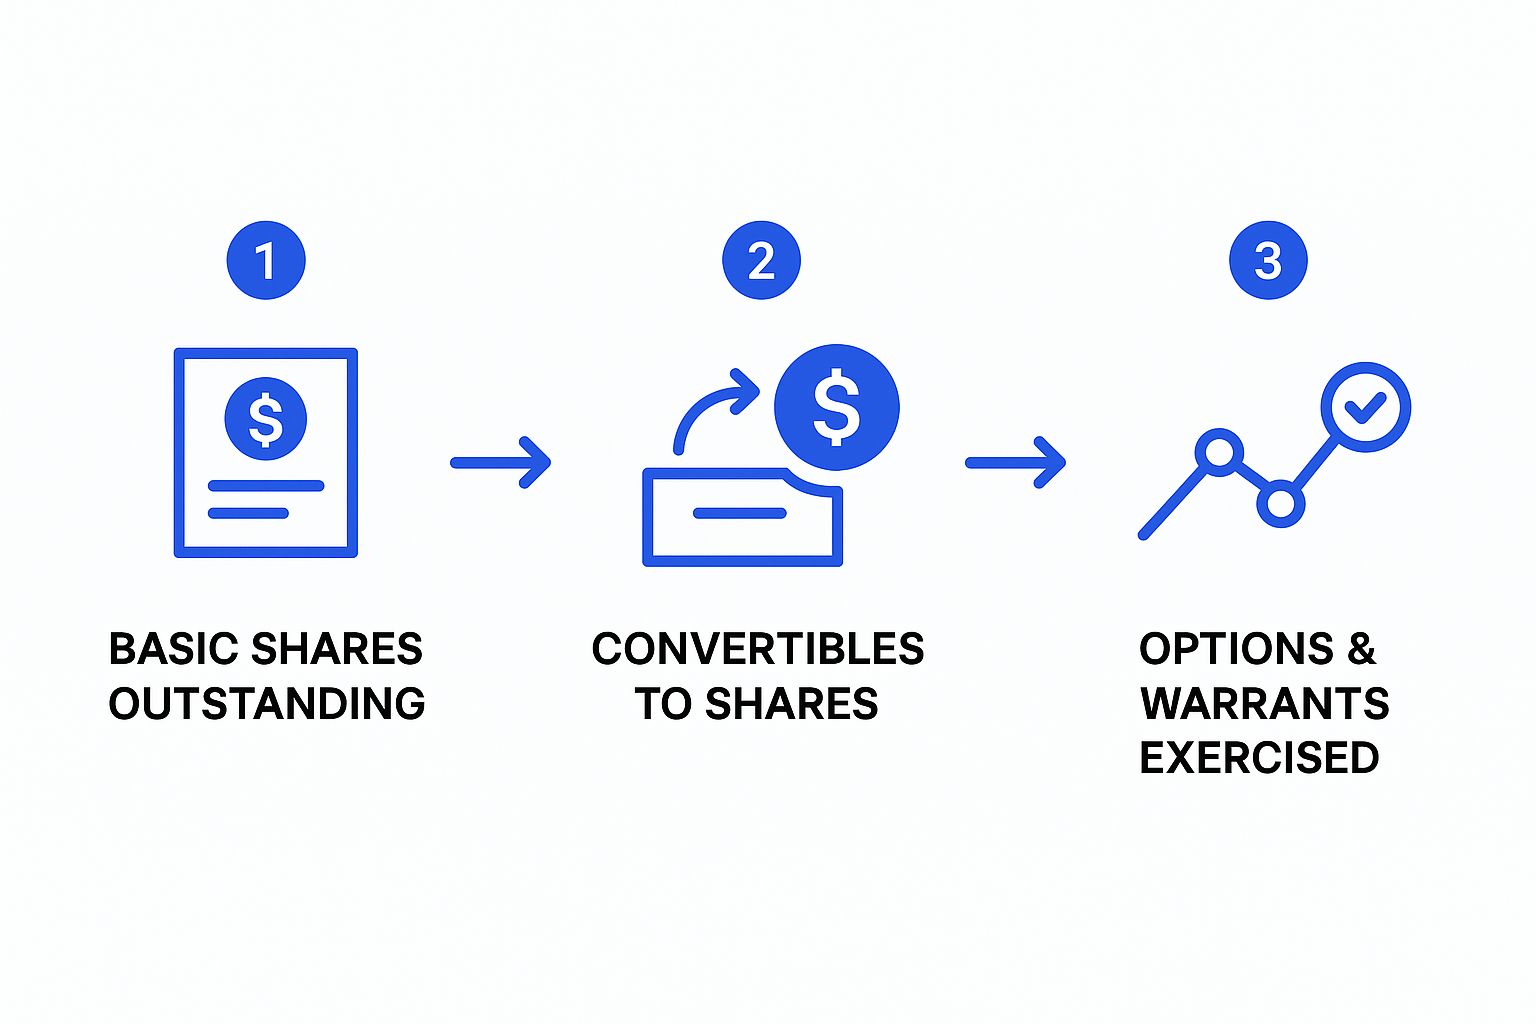
This step-by-step process reveals how each layer of potential equity contributes to the full ownership landscape.
Let's put all the numbers together in a table to make it crystal clear.
Sample Calculation for Innovate Inc.
This table breaks down how we get from basic shares to the fully diluted number for our hypothetical company.
| Share Component | Number of Shares | Cumulative Total |
|---|---|---|
| Basic Shares (Founders) | 8,000,000 | 8,000,000 |
| Convertible Notes | 1,000,000 | 9,000,000 |
| Employee Stock Options (Granted) | 1,500,000 | 10,500,000 |
| Warrants (Advisors) | 250,000 | 10,750,000 |
| ESOP (Ungranted Reserve) | 250,000 | 11,000,000 |
The final tally for Innovate Inc.’s fully diluted share count is 11,000,000 shares.
This is the number that truly matters. It represents the maximum possible ownership dilution and is the exact figure that investors, potential acquirers, and the company itself will use for valuation, calculating ownership percentages, and making strategic financial decisions.
Understanding the Instruments That Cause Dilution
To get a true picture of a company’s fully diluted shares, you first have to get your head around the financial instruments that cause dilution in the first place. These aren't just abstract entries on a spreadsheet; they're real promises of future ownership made to the people who matter most—employees, advisors, and early backers.
Think of them as different flavors of IOUs. Each one has its own unique rules about when and how it can be exchanged for actual company stock. For anyone running or investing in a growing business, knowing the mechanics of these instruments isn't just helpful—it's essential.
Employee Stock Options (ISOs and NSOs)
Stock options are the bread and butter of startup compensation. They’re a powerful way to attract and keep top talent by giving employees the right to buy company stock down the road at a fixed, often low, price (the "strike price").
- Incentive Stock Options (ISOs): These are the employee-friendly version, offering potential tax breaks. They're typically reserved for full-time team members.
- Non-Qualified Stock Options (NSOs): Far more flexible, NSOs can be given to just about anyone—employees, consultants, directors, you name it. The tax treatment isn't as sweet, but their versatility makes them incredibly useful.
From the moment they're granted, both ISOs and NSOs count toward the fully diluted share total because they represent a potential claim on future equity. Getting these incentives right is a huge part of a company’s growth strategy, and our guide on what a share incentive plan is explains this in more detail.
Warrants and Restricted Stock Units (RSUs)
Warrants and RSUs are cousins to stock options, but they tend to show up in different scenarios.
Warrants often come into play during financing deals or as a sweetener for strategic partners and advisors. They work a lot like options—giving the holder the right to buy shares at a set price—but they're usually tied to a business transaction rather than employment.
Restricted Stock Units (RSUs) are a different beast altogether. They’re a straightforward promise of future shares, typically handed out once certain milestones are hit, like an IPO or acquisition. You see them a lot in more mature private companies. The key difference? The holder doesn't buy the shares; they're granted them outright, making RSUs a very direct source of future dilution.
The conversion or exercise of all these instruments becomes particularly critical during major liquidity events. Initial public offerings (IPOs), for instance, often trigger a wave of option exercises and warrant conversions, dramatically impacting the total shares outstanding in public markets.
Convertible Instruments (SAFEs and Notes)
In the world of early-stage fundraising, convertible instruments are king. These are agreements or short-term loans that are designed to turn into equity during a later, more formal funding round.
- Convertible Notes: This is classic debt that converts into stock, usually giving the investor a discount on the share price as a reward for coming in early.
- SAFEs (Simple Agreements for Future Equity): Pioneered by Y Combinator, a SAFE isn't debt. It’s simply an agreement that gives an investor the right to own future stock, often with a valuation cap to protect their investment.
For founders trying to get a company off the ground, every funding choice has a dilutive consequence. It's a complex balancing act, which is why a good guide on how to fund a startup can be a founder's best friend. Because their entire reason for existing is to eventually become stock, these instruments are always factored into the fully diluted calculation. They represent a significant, concrete claim on the company's future.
How Dilution Plays Out in the Real World
It's one thing to understand dilution in theory, but seeing how it actually unfolds in a company's journey is something else entirely. The shares fully diluted count isn't some static number carved in stone. Think of it more as a living metric that breathes with the company—expanding with new funding rounds, growing as new talent is hired, and shifting with every strategic move.
For public companies, this story is right there for everyone to see in their mandatory financial filings. Investors and analysts comb through quarterly (10-Q) and annual (10-K) reports, watching the diluted share count like a doctor checking a patient's vital signs. A steady, predictable count often points to a mature, stable business.
On the other hand, a rapidly climbing number of fully diluted shares can tell a few different stories. It might be a sign of aggressive growth, with the company handing out stock options left and right to attract top-tier talent. It could also mean the company is raising a ton of cash through equity financing to expand, or even using its stock to buy other companies. As always, context is key.
Reading the Story Behind the Numbers
The trend of the diluted share count is often far more revealing than any single number. If you see a consistent increase, it’s time to dig deeper. Is the growth in potential shares being matched by a proportional jump in revenue and profitability? If not, existing shareholders are watching their slice of the pie get smaller without the whole pie getting any bigger.
This is where the numbers start to tell a narrative. A sudden spike might line up perfectly with a big Series C funding round. A slow, steady climb could just reflect a healthy employee stock option program at a growing tech firm.
Tracking how fully diluted shares evolve over time gives you a window into management's discipline with equity. It shows how well they're balancing the need for capital and talent against the critical job of protecting shareholder value from getting watered down.
A Real-World Example of Stability
Looking at established public companies is a great way to see these dynamics in action. Take FactSet Research Systems, a major player in financial data. They've kept their average diluted shares outstanding remarkably stable. Between 2020 and mid-2024, the count hovered right around 38 million shares.
That kind of stability is telling. It suggests the company hasn't needed to engage in major dilutive activities. It points to a mature, predictable capital structure, with minimal pressure from new share issuances, large-scale stock option exercises, or conversions of other securities during that time. You can explore more data on FactSet's share history to see these trends for yourself.
By keeping an eye on real-world examples like this, both investors and founders can get much better at interpreting what the fully diluted share count is signaling. It’s not just an abstract calculation; it’s a powerful clue about a company’s strategic direction, its approach to compensation, and its overall commitment to creating long-term value for its shareholders.
Common Questions About Share Dilution
Once you get a handle on the basics of shares fully diluted, the real-world scenarios start to get interesting. The theory is one thing, but applying it to a messy cap table is another. This is where the nuanced, practical questions pop up.
Think of this section as your go-to guide for those tricky "what if" situations that always seem to come up. We'll cut through the confusion and give you straight answers.
How Does the Treasury Stock Method Impact the Calculation?
The Treasury Stock Method is an accounting rule you'll hear about mostly in the context of public companies calculating their diluted Earnings Per Share (EPS). For private company cap table management, it’s often an unnecessary complication.
Here’s the gist of it:
- The Assumption: The method assumes that when options are exercised, the company uses the cash from that exercise to buy back its own stock on the open market.
- The Effect: This theoretical buyback reduces the number of new shares hitting the market, which lessens the overall dilutive effect on EPS.
Private companies, especially when preparing for a funding round, usually take a more direct and conservative approach. They simply add all potential new shares to the total. This approach shows the maximum possible dilution, which is exactly what new investors want to see.
For a private company founder or investor, the main takeaway is to calculate dilution based on the worst-case scenario—assuming all potential shares are issued without any offset. This provides the most honest view of ownership stakes.
Are Authorized but Unissued Shares Part of the Count?
Generally, no. The fully diluted share count is concerned with shares that have a claim on them—think issued options, warrants, or convertible instruments.
Authorized shares are just the total number of shares a company is legally permitted to issue according to its corporate charter. The unissued portion is potential equity, but until it's been promised to someone or something, it doesn't factor into the dilution calculation.
The big exception? A funding round. New investors will almost always insist that the company create or increase an employee option pool as part of the deal. Those new, unallocated options are included when calculating the pre-money valuation.
How Do SAFEs Contribute to the Fully Diluted Shares?
Simple Agreements for Future Equity (SAFEs) are a huge source of confusion and a critical piece of the dilution puzzle. Because they are designed to convert into equity at a future priced round, you absolutely have to include them in any forward-looking shares fully diluted analysis.
Figuring out their impact means making some educated guesses. You have to model their conversion based on the valuation cap or discount rate, even though the final share price is unknown. It introduces a bit of a variable, but leaving SAFEs out of the calculation would give you a completely misleading picture of the company's future ownership structure.
Juggling a fund's cap table and reporting on complex metrics like dilution can quickly become an operational nightmare. Fundpilot is built for emerging fund managers, helping them move from clunky spreadsheets to automated, institutional-grade reporting. You can streamline your back office and give your LPs the clarity they expect. Discover how Fundpilot can upgrade your fund management at https://www.fundpilot.app.