Waterfall Financial Model Guide: Master Profit Distribution
Learn how to build a waterfall financial model with clear examples. Enhance your private equity and real estate profit distribution skills today.

A waterfall financial model is really just a system for splitting up profits between partners in an investment. It lays out the exact order and priority for how cash gets paid out. The easiest way to think about it is like a series of buckets filling up one after another; the key thing to remember is that investors always get their money back first. This simple rule ensures the whole process is transparent and fair for everyone at the table.
Understanding the Waterfall Financial Model

When you get down to it, a waterfall financial model isn't just a complicated spreadsheet; it's the story of how money moves through a deal. It creates a clear, step-by-step roadmap for distributing profits between the investors, known as Limited Partners (LPs), and the fund managers, or General Partners (GPs). This structure is absolutely crucial for aligning everyone's interests and managing expectations in high-stakes ventures like private equity, venture capital, and real estate.
The model gets its name from a pretty intuitive analogy. Picture water cascading down a series of waterfalls, filling one pool completely before spilling over into the next. In the same way, investment returns flow through a series of tiers. Each tier is a specific financial target that has to be hit before any money can flow down to the next one. This creates a logical and predictable payment order.
The Purpose of a Waterfall Structure
The main goal here is to set up a fair system that rewards both the people providing the cash (the LPs) and the people doing the work (the GPs). It answers the most important question in any partnership: "Who gets paid, how much, and when?" By laying this out in black and white, the waterfall model builds a foundation of trust.
The key objectives are straightforward:
- Protecting Investor Capital: The very first tier, without fail, ensures LPs get their initial investment back before the GPs even think about sharing in the profits.
- Setting Performance Benchmarks: It establishes a preferred return, often called a "hurdle rate." This is a minimum rate of return LPs must earn before the GP’s performance fee kicks in.
- Incentivizing Fund Managers: Once investors are made whole and have received their preferred return, the model rewards GPs with a slice of the remaining profits, known as carried interest. This powerfully motivates them to maximize the deal's success.
This tiered structure is the bedrock of partnership agreements in alternative investments. It ensures LPs are prioritized while still giving GPs significant upside for strong performance, creating a powerful symbiotic relationship.
Core Components of a Waterfall Model
To really grasp how these models work, you need to understand the fundamental pieces they're built from. These components are the building blocks that define how and when cash moves between partners.
Here’s a quick breakdown of the essential parts and the role each one plays:
| Component | Description | Typical Range/Value |
|---|---|---|
| Return of Capital (ROC) | The first tier where LPs get back 100% of their initial investment. | The full amount of capital contributed by the LPs. |
| Preferred Return | A minimum annual return LPs must receive on their capital before GPs share profits. | 7-8% is a common benchmark in real estate and private equity. |
| GP Catch-Up | A mechanism allowing the GP to receive a large portion of profits to "catch up" to their agreed-upon profit share. | Often structured so the GP receives 80-100% of profits until they hit their target split. |
| Carried Interest | The GP's share of the profits after all prior tiers are satisfied. This is their performance fee. | 20% of remaining profits is the industry standard. |
These building blocks are what make the waterfall model such a reliable and widely used tool for aligning interests in funds all over the world.
This distribution framework is critical for aligning interests in funds globally. In fact, research shows that about 69% of Real Estate Investment Trusts (REITs) use waterfall models to allocate cash flows, complete with hurdles and catch-up clauses. This widespread adoption shows just how effective it is. The structure ensures LPs first get their capital back plus a preferred return (often 7-8% annually) before GPs receive their carried interest, which is typically 20% of profits. You can dive deeper into these industry benchmarks over at Moonfare.
The Four Tiers of a Distribution Waterfall
Think of a distribution waterfall like a series of cascading pools. Cash flows into the top pool, and once it's full, it spills over into the next one, and so on. This sequential process ensures that everyone gets paid in the right order, fulfilling specific promises made to both the Limited Partners (LPs) who provide the capital and the General Partner (GP) who manages the investment.
This structure is the bedrock of most fund agreements, carefully balancing risk and reward. It all starts with the most fundamental promise: getting investors their initial money back. Only after that happens do the tiers for profit-sharing even come into play. It's a system designed to protect the investor first while still giving the manager a powerful incentive to perform.
Let's look at the big picture of how this flow works, from the first dollar invested to the final profit split.
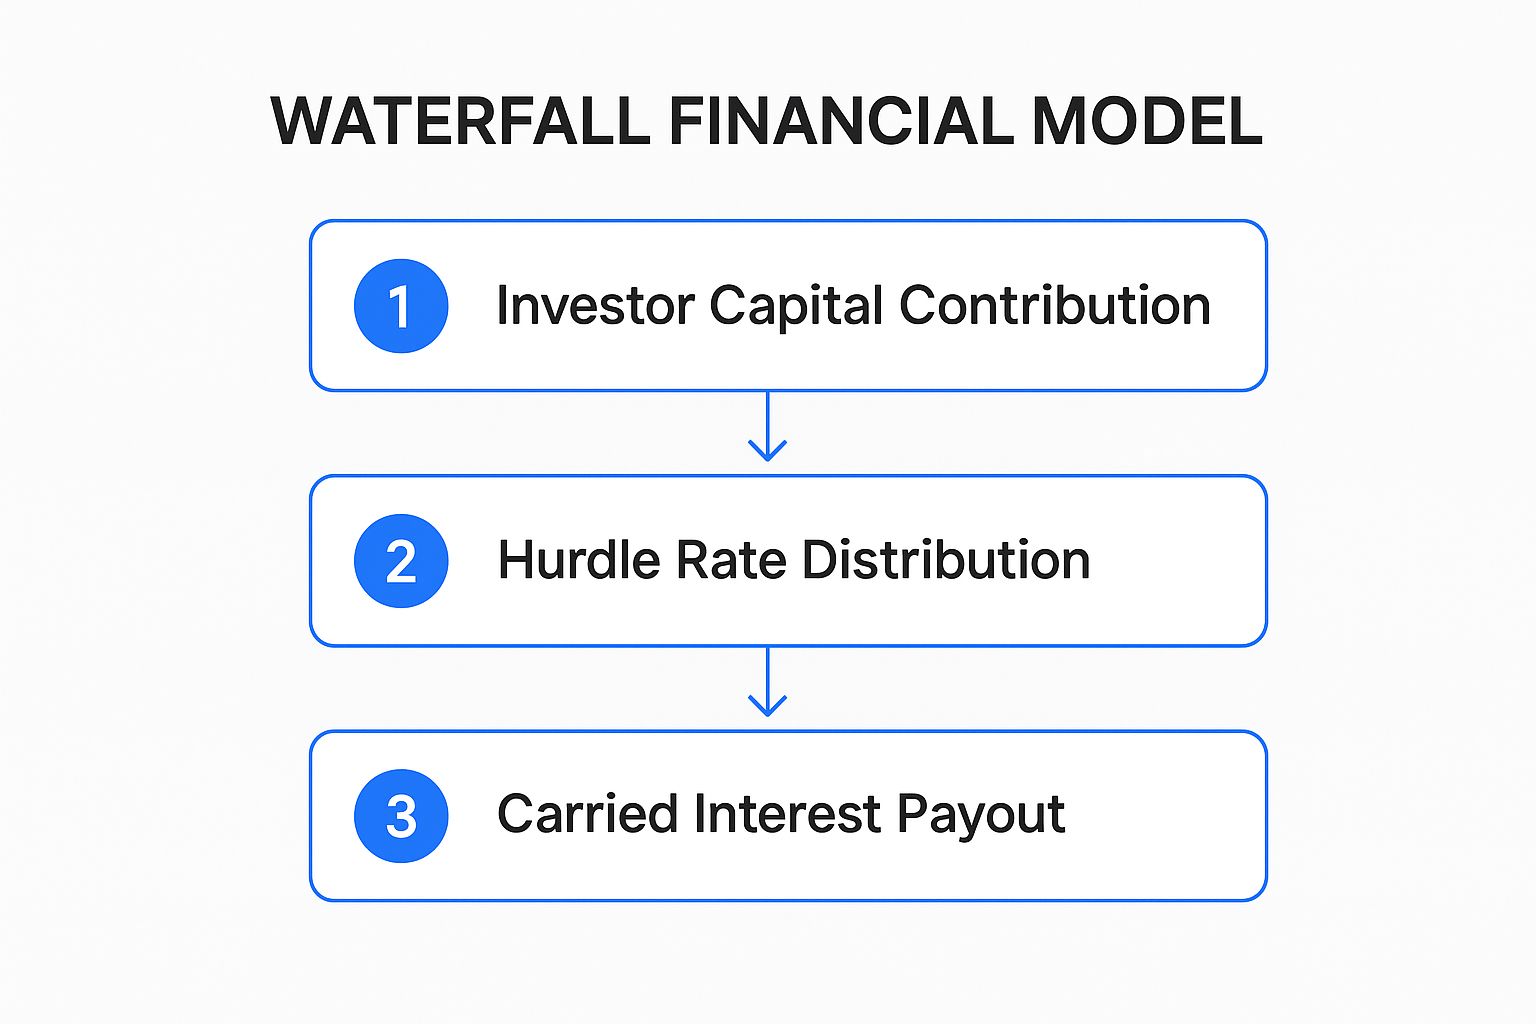
As you can see, the waterfall directs all initial returns to the LPs to cover their capital and a minimum return. The GP's share, the carried interest, only comes into the picture after those benchmarks have been met.
Tier 1: Return of Capital
First things first. Before anyone talks about profits, the top priority is making the investors whole. This is the Return of Capital (ROC) tier, and its rule is simple: 100% of all distributable cash goes to the LPs until they have received every penny of their original investment back.
It’s the ultimate safety net. It establishes a clear principle: your initial capital risk is covered before the fund manager shares in any of the upside. If an LP puts $5 million into a fund, the very first $5 million in returns from successful exits goes straight back to that LP. No exceptions.
Tier 2: The Preferred Return
With all initial capital safely returned, the waterfall spills into the second tier: the Preferred Return. This is a pre-agreed minimum annual return that LPs must earn on their investment before the GP is eligible to collect a performance fee. You'll often hear this called the "hurdle rate."
Think of it as an interest payment to the LPs for the risk they took and for having their money tied up. In the world of private equity and real estate, a common hurdle rate is around 7-8%.
The hurdle rate sets a performance benchmark. It effectively says to the GP, "You must generate returns above this baseline level to prove your strategy is creating value worthy of a performance fee."
So, if a fund achieves a 9% return, it has successfully cleared the hurdle. But if it only generates a 6% return, all of that money goes to the LPs because the GP hasn't met the performance threshold yet.
Tier 3: The GP Catch-Up
Once the LPs have their capital back and have received their full preferred return, we hit the GP Catch-Up tier. As the name suggests, this stage is designed specifically for the General Partner to "catch up" on their share of the profits.
Since the first two tiers direct all proceeds to the LPs, this is where the economics start to rebalance. During the catch-up, the GP receives a much larger slice of the distributions—often 80% or even 100%—until their take equals the agreed-upon carried interest percentage (typically 20%) of the profits distributed through both Tier 2 and Tier 3.
It’s a corrective mechanism. It ensures that by the end of this stage, the profit split aligns with the final arrangement that both parties agreed to at the outset.
Tier 4: The Carried Interest Split
At last, the waterfall reaches its final destination. Once the GP catch-up is complete, every dollar of profit from here on out is split according to the carried interest, also known as the "promote."
This is the ongoing, long-term profit-sharing arrangement. The most common structure by far is an 80/20 split:
- 80% of all remaining profits go to the Limited Partners (LPs).
- 20% of all remaining profits go to the General Partner (GP).
This 20% is the GP's main reward for delivering returns that cleared every previous hurdle. From this point forward, the interests of the GP and LPs are perfectly aligned, as they share in every future success according to this simple ratio.
European vs American Waterfall Structures

While the four-tier structure is the universal blueprint for a waterfall financial model, a crucial difference emerges when it comes to when the General Partner (GP) gets paid. This timing question creates a major fork in the road, leading to the two dominant industry standards: the European waterfall and the American waterfall.
The choice between them isn't just a technicality—it's a strategic decision that speaks volumes about a fund's philosophy. It signals to investors whether the fund prioritizes long-term, collective success or rewards early, individual wins. For anyone looking at a private equity or venture capital deal, understanding this difference is absolutely critical.
The European Waterfall: Patient and Investor-First
The European model, often called a "fund-as-a-whole" waterfall, is the more conservative of the two. Think of it as one giant pool for the entire fund. Before the GP can touch a single dollar of carried interest, two massive hurdles must be cleared for the entire portfolio:
- 100% Return of Capital: Limited Partners (LPs) must get back every penny they've invested across all deals in the fund—the winners and the losers combined.
- Full Preferred Return: LPs must also receive their entire preferred return, calculated on all of that contributed capital.
Only after this fund-level pool is full and overflowing do distributions finally spill over to the GP. This structure ensures the fund is truly profitable overall before the manager gets their performance fee. It’s a powerful protection for LPs, shielding them from a scenario where a GP pockets a big fee on an early exit, only for later deals to fail and pull the fund's total return into the red.
In short, the European model forces the GP's success to be tied directly to the entire fund's success. It demands patience and a holistic view, as managers don’t get rewarded until their investors are made whole and have hit their baseline return.
The American Waterfall: Incentive-Driven and Deal-by-Deal
The American waterfall, on the other hand, operates on a "deal-by-deal" basis. Instead of one big pool, imagine each investment has its own mini-waterfall. As soon as a single investment is exited for a profit, the cash from that specific deal runs through its own four-tier cascade.
This means a GP can start earning carried interest on a huge success story long before the LPs have gotten all their capital back from the fund. If a fund makes ten investments and the very first exit is a home run, the GP can collect their 20% carry on that deal’s profits right away (after that deal's investors are paid back their capital and pref).
Naturally, this structure is a powerful motivator for GPs, rewarding them for early wins. The downside? It pushes more risk onto the LPs. What if those next nine deals are duds? The GP has already been paid, but the LPs could face a net loss on the fund as a whole.
To counter this risk, American waterfalls almost always include a clawback provision. This is a contractual safety net that gives LPs the right to "claw back" carried interest distributions from the GP at the end of the fund's life if the fund's overall performance doesn't clear the hurdle rate.
Key Structural Differences at a Glance
The core distinction boils down to the unit of measurement: the entire fund versus the individual deal. The European waterfall, a common structure in venture capital and private equity, requires LPs to fully recover their entire investment before GPs share in the profits. For a $100 million fund, this means LPs must get back the full $100 million plus their preferred return before the GP earns any carry. This model offers strong downside protection for LPs but can significantly delay GP payouts. You can dig deeper into how these models work in venture capital with this great explainer from GoingVC.
Here's a simple breakdown of the two approaches:
| Feature | European Waterfall | American Waterfall |
|---|---|---|
| Calculation Basis | Fund-as-a-whole | Deal-by-deal |
| GP Payout Timing | Late in the fund's life | Early, as deals successfully exit |
| LP Risk Profile | Lower risk | Higher risk (mitigated by clawback) |
| GP Incentive | Aligned with overall fund success | Aligned with individual deal success |
| Clawback Need | Rarely needed | Absolutely essential |
Ultimately, the American model leans toward motivating GPs with quicker payouts, while the European model prioritizes LP security with a more patient, all-encompassing approach.
How to Build a Simple Waterfall Model
Talking about a waterfall financial model is one thing, but the real lightbulb moment happens when you actually build one. Rolling up your sleeves and creating a simple model, even in a basic spreadsheet, is the best way to move from abstract theory to practical understanding. It makes the whole process click.
Before you can crunch any numbers, you need to lay the groundwork by defining the key assumptions. These are the rules of the road for your model, dictating how every dollar of profit will be handled.
You’ll need to nail down a few essential inputs:
- Total Invested Capital: The total cash put in by the Limited Partners (LPs).
- Preferred Return (Hurdle Rate): The minimum annual return LPs are promised before the fund manager sees a dime of profit. A common figure is 8%.
- GP Catch-Up Percentage: The portion of profits the General Partner (GP) gets during the catch-up phase. This is often 100% until the GP is "caught up."
- Carried Interest Split: The final profit-sharing agreement, which is most commonly 80% for the LPs and 20% for the GP.
Once you have these assumptions locked in, you can start building out the calculations for each tier, creating a clear path for the cash to flow.
Setting Up a Hypothetical Scenario
Let's walk through this with a straightforward example. Picture a small private equity fund with these terms:
- Total LP Capital Invested: $10,000,000
- Total Exit Proceeds (Distributable Cash): $25,000,000
- Investment Period: 5 years
- Preferred Return (Hurdle Rate): 8% per year (we'll keep it simple with non-compounding interest)
- GP Catch-Up: 100%
- Carried Interest Split: 80/20
With $25 million in proceeds from a $10 million investment, we have a total profit of $15,000,000 to run through our waterfall.
Calculating the Distribution Tiers
Now, let's follow the $25,000,000 as it cascades through our four-tier model.
Tier 1: Return of Capital (ROC) First things first: the investors get their original money back. This rule is non-negotiable.
- Calculation: 100% of the proceeds are paid to the LPs until their initial contribution is fully returned.
- Distribution to LPs: $10,000,000
- Cash Remaining for Next Tier: $15,000,000
Tier 2: Preferred Return With their principal returned, the LPs are now due their 8% annual preferred return for the 5-year life of the investment.
- Calculation: $10,000,000 (Capital) x 8% (Hurdle) x 5 (Years) = $4,000,000
- Distribution to LPs: $4,000,000
- Cash Remaining for Next Tier: $11,000,000
At this stage, the LPs have received a total of $14,000,000—their full investment plus their entire preferred return.
A crucial detail that dramatically changes the math is whether you use a deal-by-deal (American) or a whole-fund (European) waterfall. This decision has a huge impact on when the GP gets paid.
Imagine a $200 million fund invested in two separate projects. If one project exits early with a massive profit, an American waterfall lets the GP collect carried interest on that single successful deal right away. But with a European waterfall, all proceeds are pooled. The GP would have to wait until the entire fund's LP capital and preferred returns are paid out, which could be years later. This single choice can completely alter the timing and risk profile for both parties. You can see how American vs. European waterfall calculations differ in a more detailed example.
Tier 3: The GP Catch-Up Now it's the GP's turn. This tier is designed to let the manager "catch up" so their share of the profits aligns with the final carried interest split. The profits generated so far consist of the LPs' preferred return ($4,000,000) plus whatever is distributed in this tier.
- Target GP Share: The goal is to get the GP to a 20% share of the profits distributed to this point.
- Calculation: We need to figure out how much cash gets the GP to their 20% target. The math looks like this: Preferred Return / (1 – GP Carried Interest %) – Preferred Return.
- Catch-Up Amount: $4,000,000 / (1 - 0.20) - $4,000,000 = $1,000,000
- Distribution to GP: $1,000,000 (The GP gets 100% of the cash in this tier)
- Cash Remaining for Next Tier: $10,000,000
Tier 4: Carried Interest Split Finally, we've reached the last tier. All remaining profits are now split according to the 80/20 carried interest agreement.
- LP Share (80%): $10,000,000 x 0.80 = $8,000,000
- GP Share (20%): $10,000,000 x 0.20 = $2,000,000
And just like that, you’ve walked through all the steps of a simple but powerful waterfall financial model.
Hypothetical Waterfall Calculation Example
Here's a table that neatly summarizes how the cash flows through each tier in our private equity fund example. It’s a great way to visualize the entire distribution from start to finish.
| Distribution Tier | Cash In | Distribution to LP | Distribution to GP | Cash Remaining |
|---|---|---|---|---|
| Return of Capital | $25,000,000 | $10,000,000 | $0 | $15,000,000 |
| Preferred Return | $15,000,000 | $4,000,000 | $0 | $11,000,000 |
| GP Catch-Up | $11,000,000 | $0 | $1,000,000 | $10,000,000 |
| Carried Interest | $10,000,000 | $8,000,000 | $2,000,000 | $0 |
| Total Distribution | $22,000,000 | $3,000,000 |
As you can see, the final profit distribution is $22,000,000 to the Limited Partners and $3,000,000 to the General Partner, perfectly accounting for the $25,000,000 in total proceeds.
Common Waterfall Modeling Mistakes to Avoid

When you're building a waterfall financial model, everything can look perfectly logical on the surface. But even the tiniest errors in your spreadsheet can snowball into massive financial headaches, and I’ve seen it happen to even the most seasoned professionals. A single misplaced formula can improperly shift millions of dollars between Limited and General Partners.
Getting this right isn't just a matter of good practice—it's about protecting your partners and yourself. Precision is everything. By getting ahead of the most common mistakes, you can build models that are accurate, reliable, and stand up to scrutiny when it's time to distribute profits.
Misinterpreting Hurdle Rate Calculations
One of the most frequent—and expensive—mistakes I see is messing up the hurdle rate calculation. An 8% preferred return sounds straightforward, right? Not so fast. The real complexity lies in how that return is calculated day-to-day.
- Compounding Errors: Does the hurdle compound? If so, is it annually, quarterly, or on some other schedule? Getting the compounding frequency wrong, or forgetting it entirely, will drastically understate the preferred return owed to your LPs over the fund's life.
- Timing of Capital Calls: The clock on the hurdle starts when the capital is actually contributed, not when it's committed. If you apply the rate to the entire commitment from day one, you’ll artificially inflate the pref and unfairly delay the GP's profit participation.
A poorly defined or miscalculated hurdle rate is a recipe for disputes. It directly impacts every subsequent tier of the waterfall, skewing the GP catch-up and the final carried interest split, making it a critical point of failure in any waterfall financial model.
Using Vague LPA Definitions
Your financial model is a direct translation of a legal document: the Limited Partner Agreement (LPA). If the LPA uses fuzzy language, you’re basically building your model on a shaky foundation. This ambiguity opens the door for conflicting interpretations that can easily derail a partnership.
Your model has to be a mirror image of the LPA’s definitions for critical terms. What, exactly, counts as a "capital contribution"? Is it just fresh cash from LPs, or does it include capital recycled from early exits? Is the "return of capital" calculated deal-by-deal or on a whole-fund basis? Leaving these questions unanswered is a huge risk.
Underestimating Catch-Up Complexity
The GP catch-up is one of the most misunderstood parts of the waterfall. It's not just a simple bonus for the GP. It’s a very precise mechanism designed to bring the overall profit split to the agreed-upon ratio, like 80/20.
Here are a couple of ways it often goes wrong:
- Incorrect Base for Calculation: The catch-up isn't calculated in a vacuum. It must be based on the right profit base, which includes distributions made under the preferred return and the catch-up tier itself.
- Ignoring the Split: I've seen models where the GP catch-up is modeled as a 100% allocation to the GP that never stops. This is wrong. The catch-up's job is to get the GP to their target percentage, after which distributions flip to the final carried interest split.
Neglecting Clawback Provisions
In a deal-by-deal (or American-style) waterfall, the clawback provision is the investor's ultimate safety net. It’s what allows LPs to get back carried interest paid to the GP on early profitable deals if the fund later suffers losses.
If your model doesn't account for this, it’s painting an incomplete and overly rosy picture for the GP. A robust model absolutely must track cumulative fund performance to accurately test if—and when—a clawback might be triggered. Ignoring it is like driving without a rearview mirror.
Getting into the Weeds: Advanced Waterfall Features
Once you've got the basic structure down, you start to see where the real-world complexities come in. A simple waterfall financial model is a great starting point, but the pros need to grapple with features that protect partners and sharpen incentives. These are the tools that turn a standard template into a highly specific, robust agreement.
We'll look at three of the most important ones: clawbacks, multi-hurdle waterfalls, and side letters. Each adds a crucial layer of detail, helping to manage specific risks and opportunities that pop up over a fund's life. Getting these right is key to building fair and durable partnership agreements.
The Clawback: An Essential Safety Net for Investors
Think of the clawback as a non-negotiable insurance policy for investors, particularly in American-style, deal-by-deal waterfalls. It gives Limited Partners (LPs) the right to take back performance fees (carried interest) already paid to the General Partner (GP) if the fund's overall performance doesn't end up meeting the agreed-upon targets.
It's easy to see why this is so important. Imagine a fund hits a home run on its very first exit, and the GP takes a hefty performance fee. But what if the next few deals are duds, dragging the fund's total return below the hurdle rate? Without a clawback, the LPs could be left with a subpar return, or even a loss, while the GP has already pocketed a big chunk of cash. The clawback fixes this potential mismatch.
At the end of the fund’s life, a final "true-up" calculation settles the score. If it turns out the GP was overpaid based on the fund's total performance, they have to give that excess carry back to the LPs. This mechanism ensures the GP is rewarded for the fund's holistic success, not just a few lucky early wins.
Multi-Hurdle Waterfalls: Aligning Incentives for Higher Returns
While a single hurdle rate is common, some funds use a multi-hurdle waterfall to create more dynamic performance incentives. This structure basically offers the GP a bigger slice of the pie as they deliver increasingly higher returns to investors. It's a powerful way of saying, "The better you do for us, the better you do for yourself."
Here’s a simple example of how a multi-hurdle structure might work:
- First Hurdle (e.g., 8% IRR): Once LPs get their capital back plus this first return, profits are split 80/20.
- Second Hurdle (e.g., 12% IRR): If the fund's performance clears this next bar, the profit split for all future gains might shift to 75/25.
- Third Hurdle (e.g., 15% IRR): For truly exceptional performance beyond this point, the split could even jump to 70/30.
This approach is fantastic for high-growth strategies. It creates a powerful alignment of interests by directly rewarding the GP for swinging for the fences and generating outstanding returns for their LPs.
Side Letters: The World of Bespoke Agreements
Finally, it's important to remember that not all LPs are created equal. An institutional investor committing a massive amount of capital will often have the leverage to negotiate special terms. These terms are captured in a side letter—a legal document that amends the standard Limited Partner Agreement (LPA) just for that one investor.
These custom deals can change the waterfall model in a few ways, maybe by offering that investor a lower management fee or a better carried interest split. While side letters can be a great tool for attracting big-ticket anchor investors, they introduce a significant layer of complexity. Fund managers have to track these variations meticulously, effectively running several parallel waterfall calculations to make sure every partner is paid out correctly.
Common Questions About Waterfall Models
Even when you've got the basics down, a few practical questions always pop up when you start building or dissecting a real-world waterfall model. Let's tackle some of the most common ones that fund managers and investors run into.
What Is a Clawback in a Waterfall Model?
Think of a clawback as a crucial safety net for Limited Partners (LPs). It’s a provision that allows the fund to "claw back" carried interest that has already been distributed to the General Partner (GP) if, down the line, the fund's total performance doesn't actually clear the return hurdles everyone agreed on.
This becomes especially important in American-style waterfalls. A GP might get a hefty payout from a big win early on, only for later deals to underperform or lose money. The clawback makes sure the GP's final take-home pay is based on the entire fund's performance, not just a few lucky early exits.
How Does a GP Catch-Up Provision Really Work?
A GP catch-up is a specific tier in the distribution stack designed to accelerate the manager's share of the profits. Once investors have gotten their initial capital back and their full preferred return, the catch-up tier kicks in, often allocating 80% or even 100% of the next distributions to the GP.
This temporary, oversized split continues until the GP has "caught up" to their full contractual carried interest (say, 20%) on all profits earned so far. It’s a mechanism to true-up the GP's compensation.
Once the GP is fully caught up, the waterfall moves to the final tier, where all future profits are split according to the standard agreement—most commonly, the familiar 80/20 split. This ensures the final distribution math lines up perfectly with what was promised.
Are Waterfall Models Used Outside Private Equity?
Absolutely. While they're a cornerstone of private equity and venture capital, waterfall models are incredibly useful in any investment structure with tiered profit-sharing. Their flexibility makes them a go-to tool across many sectors.
You’ll see them pop up all the time in:
- Real Estate Development: To split the proceeds from property sales between the developer and the money partners.
- Joint Ventures: Where partners bring different things to the table (like capital vs. expertise) and agree on performance-based payouts.
- Film Financing: To figure out how box office revenue gets carved up between producers, talent, and investors.
- Energy Projects: For divvying up profits from oil, gas, or renewable energy ventures among stakeholders.
Really, any deal where capital partners agree that profits should be distributed based on performance can benefit from a waterfall financial model.
Ready to move beyond messy spreadsheets and manual reporting? Fundpilot gives emerging fund managers the institutional-grade tools they need for LP communications, fund administration, and performance analytics. You can streamline your back office, keep your investors happy, and get back to what you do best—sourcing great deals and raising capital. Schedule your demo with Fundpilot today.